Charlton - weather & climate
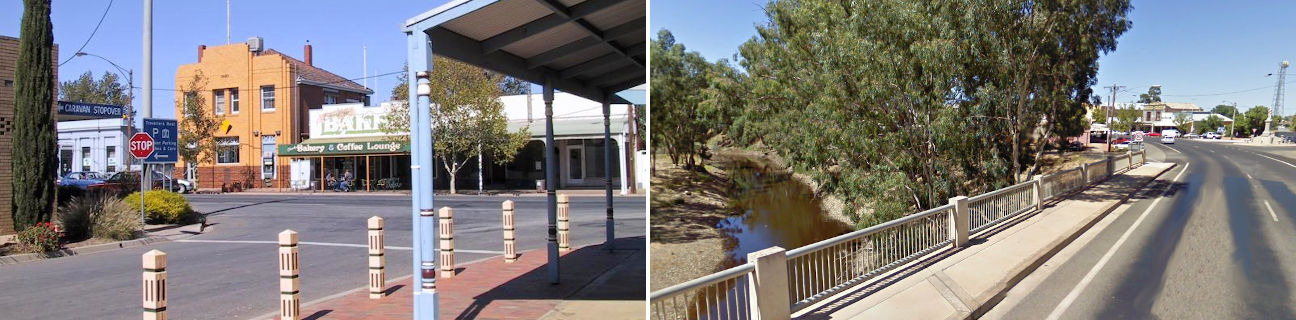
Charlton
Stay
See and do
Food and drink
Shopping
Getting around
Visitor information
Weather forecasts
Charlton 7 day forecast

Charlton in the next 48 hours

Current weather conditions
Charlton
Local weather station showing temperature, air pressure, humidity, wind and rainfall
Rainbow 128 km radar
Shows rain and hail
Satellite image
Visible satellite images are a photographic snapshot of cloud, however thin high cloud may not show up well. Infrared satellite images are derived from the temperature of the sky, with black indicating no cloud and increasing white higher colder clouds. Infrared images may not show warmer low cloud and fog.
Climate averages
| Month | Daily minimum (°C) | Daily maximum (°C) | Days of rain | Rainfall (mm) |
|---|---|---|---|---|
| January | 13.4 | 30.5 | 3.0 | 22.1 |
| February | 13.9 | 30.8 | 2.8 | 24.6 |
| March | 11.7 | 27.2 | 3.3 | 23.5 |
| April | 8.4 | 22.4 | 5.0 | 27.7 |
| May | 5.8 | 17.6 | 7.3 | 36.5 |
| June | 3.4 | 13.8 | 8.9 | 39.0 |
| July | 3.1 | 13.5 | 9.9 | 36.8 |
| August | 3.8 | 15.2 | 9.6 | 38.5 |
| September | 4.7 | 18.0 | 8.0 | 37.8 |
| October | 7.1 | 21.9 | 7.0 | 37.9 |
| November | 9.8 | 26.4 | 4.9 | 29.7 |
| December | 12.0 | 29.3 | 3.7 | 25.3 |
| Statistics provided by BOM for Wycheproof (nearest comparable weather site to Charlton) | ||||